
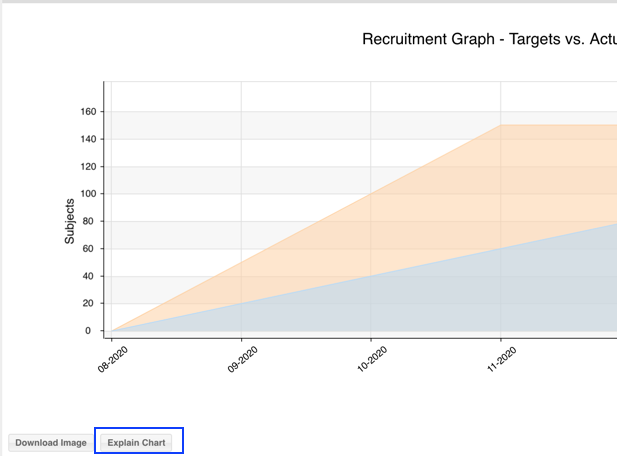
Click on the “Explain Chart” button in the lower left portion of the graph to display the details regarding what data contributes to the formation of this chart. This is available for all charts.
If you have ensured that all required data is entered in the correct areas and the graph is still not correct, please submit a ticket to Support.
Comments
0 comments
Article is closed for comments.